The TL;DR key points
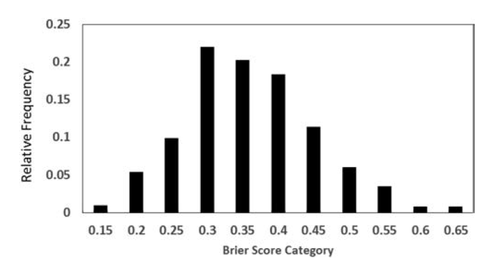
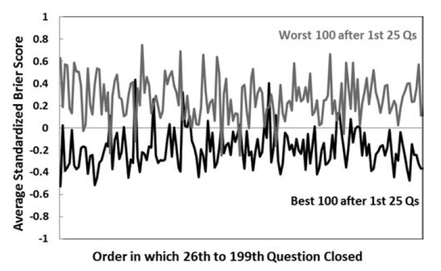
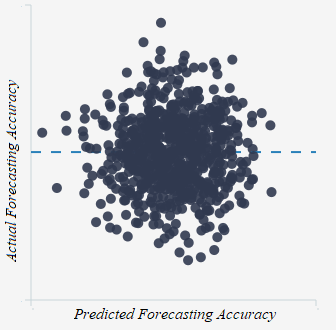
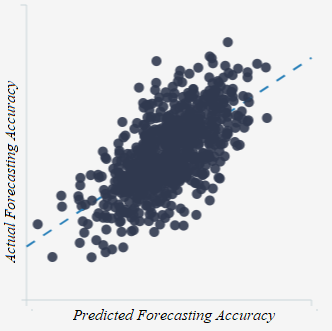
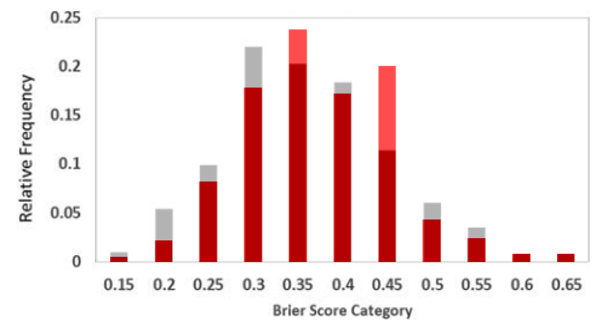
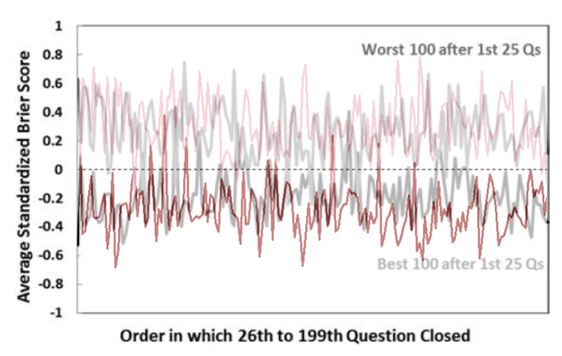
2. When we do this, people are better forecasters than it initially appeared 3. And we are able to explain and predict accuracy better than it initially appeared Good Judgment: Why you should care about itWe all make judgments every day. We all depend on them to make decisions and to live our lives. You might think someone is a good partner for you, and so you might marry them. Or you might think you will be happy in a particular career, and so you might spend countless hours of your life studying and working your way towards it. But what happens if your judgments are wrong—if the person you married or the career you chose weren't good options? We all know that this kind of thing happens: people make bad judgments and regret their decisions all the time. That is old news—and bad news, at that. What’s more, if we take a passing glance at the scientific study of reasoning, we’ll see that we are often biased in our judgments and we may not even realize it (check out Kahneman's fantastic book, for instance). But there is good news: we can improve our judgments! The Good Judgment ProjectThe Good Judgment project tells us something about how to do that. It was a 4-year program that was launched with funding from a US intelligence organization. Its aim? Well, to figure out what makes for good judgments. They focused on judgments about largely political questions—the outcomes of elections, wars and the like. But their insights are arguably generalizable to other contexts too (and I will write another blog post on this later). To this end, they studied 743 people who made over 150,000 forecasts from 2011 to 2013. Each forecast was a probabilistic prediction about what would happen in the future, and the forecasters were then scored based on the probability that they attached to the actual outcome. For example, if you attached a 90% probability to Putin winning the 2012 Russian presidential election (which obviously happened), then you’d get a better accuracy score than if you assigned it, say, only a 60% probability. Insights from the Good Judgment ProjectTheir project uncovered a few insights. 1. Not everyone is equally good at predicting the future This by itself isn't all that surprising, but it's good to get a sense of how people vary in their abilities. This graph helps us do that: It tells us how accurate the participants were, using a measure called the Brier score. A Brier score isn't always the easiest thing to understand immediately--so don't worry about it too much. But note that the lower the Brier score, the better. Perhaps think about it as a measure of your inaccuracy—how far your probability forecasts are from the truth. In that sense, you'd want it to be low. Regardless, the graph tells us that most people had an average Brier score of around 0.32—the kind of thing we could expect if, for example, someone assigned a 60% probability to the true outcome on average. Some did much better than this: about 2% of participants had an average Brier score around 0.15—the kind of thing we could expect if, for example, they assigned a 73% probability to the true outcome on average. These people were called superforecasters, and they are the subject of Philip Tetlock’s best-selling book Superforecasting: The Art and Science of Prediction. Unfortunately, other people did much worse: some even had a Brier score of around 0.65, as though they assigned only a 42% probability to the true outcome on average. In other words, they're wrong most of the time, and it'd be better to flip a coin than to accept their opinion on a question! 2. Accuracy isn't just due to chance But of course, if enough people make enough predictions about anything, some are bound to get it right--and just by chance. How can we know whether this is what's going on here? Well, there's different ways to do this, but one way is to look at whether people's accuracy changes over time. If some people were accurate at the beginning--and this was just by chance--then you'd eventually see their luck wear off: after a while, they'd start to look about as accurate as the average person. You'd also expect a similar kind of thing for those who were the least accurate: their bad luck would wear off and they'd look relatively better over time. This would be an example of regression to the mean—as they say. But this isn't what the Good Judgment project found. Instead, the best people after the first 25 questions stayed relatively good. Meanwhile, the not-so-good people also stayed not so good. We can see this in the below graph (but remember that higher Brier scores are bad, and so the "Worst" forecasters are on top): 3. We can explain and predict accuracy--well, somewhat So what made the good forecasters so good? To answer this question, the Good Judgment project examined information about all 743 people and they asked them questions about their knowledge, their ways of thinking and other topics. They found that three categories of features correlated with accuracy: 1. Your dispositions - What you know and how you think One category is about your psychological dispositions—features of your mind and the way you think. This includes things like: how likely you are to override your quick gut reactions with more prolonged and careful thinking; how much general knowledge you have that might be relevant to your forecasting topics; your probabilistic and statistical reasoning abilities; how open you are to admitting the fallibility of your own judgment, and your willingness to unbiasedly evaluate evidence, including evidence against your own viewpoints. The more you have these features, the more accurate you are likely to be. 2. Your situation - Teaming and training Another category includes features about your situation: in particular, whether you were teamed up with others when making predictions and/or had some training about biases and statistical reasoning. 3. Your behavior - What you do Another category includes behavioral features: in particular, the more time you spent thinking about a question and updating your opinions about it, the more likely you were to be accurate. How much does this explain? These features can explain a lot of what makes a good forecaster, but not all of it. Other factors also play a role, including some amount of good luck. How do we tell, then, just how much could be explained by the three categories of features? To do this, data scientists often recruit the help of regression models. A regression model is a mathematical equation which makes predictions given various features. In our context, it would tell you that if you have such-and-such levels of open-mindedness, political knowledge etc., then your accuracy will be so-and-so. Of course, these models never predict people’s accuracy with perfect precision, but they can do a pretty good job of it. The extent to which they do a good job can be measured in various ways. One way is with a multiple R measure. (We could also supplement this with some particular inferential statistics, such as p-values, frequentist confidence intervals or Bayesian credible intervals, but I won't bore you with the sometimes controversial details of these in a simple blogpost like this.) To calculate the multiple R, you look at the predictions of accuracy according to the regression model and then see how well that correlates with the actual accuracy of people. We can then measure that correlation with a number between 1 and -1. If that number is 0, then there's no correlation between the predictions on the one hand and the actual accuracy of people on the other. Then, the we'd have a graph that could look like this: A Multiple R of 0 Generated from R Psychologist Above, each point represents a person. The horizontal x-axis represents how accurate they are according to the predictions of the model: the further to the right you are, the better your predicted accuracy. The vertical y-axis represents how accurate they actually are: the higher up you are, the better your actual accuracy. And in the above graph, there is no relationship between the two: knowing something about your predicted accuracy tells you nothing about your actual accuracy. For example, the model might predict you'd have a Brier score of 0.65 when it might actually be 0.15. Fortunately, though, the Good Judgment project's data does not look like that! They don't provide a graph, but they do say that their R value is .64. This is would be the kind of thing you'd expect if the graph looked more like this: This looks a lot better: the predictions would not tell you precisely what your accuracy is, but you're much more likely to have high actual accuracy if your predicted accuracy is similarly high. For example, the model might predict you'd have a Brier score of 0.37 and it turns out your accuracy is around 0.32. But remember what the model uses to make these predictions: it takes into account just the three categories of features mentioned earlier—the kind of things you could describe in a survey. It then uses just that information to do a decent job of predicting your accuracy. For that reason, statistical evidence like this suggests what might explain accuracy, although scientists often also rely on theory or experimental evidence to inform their explanatory conclusions. In our case, there's a variety of reasons to think these features actually do explain accuracy, and that's good--because then we have a better sense of how to improve accuracy. Reproducibility CrisisIf their analysis is correct, then it's good news: we know a fair bit about what can improve the accuracy of our judgments. But is their analysis really correct? As you might've heard, many scientists—if not most—believe that science is in the grips of a reproducibility crisis. Fiona Fidler and I have written about this in this Stanford Encyclopedia of Philosophy entry. In some cases, half of the attempts to reproduce past findings have failed, leading many to conclude that what was once regarded as true was actually false. This has primarily been a concern when it comes to reproducing data collection procedures, like experiments or surveys. But it is also a concern when it comes to analyzing past data: problems sometimes arise from how the data was analyzed—not just with how it was collected. So, then, can we reproduce the findings of the Good Judgment program using their data? A Re-Analysis: A Success!To answer this question, I took a look at their data on Harvard's dataverse website. I then tried to reproduce several key statistics (and feel free to contact me if you want my analysis scripts in Python and R). Some Difficulties There were some difficulties along the way. One is about their exclusion criteria. They wanted to study the accuracy of people, and to do that, they needed to collect a lot of forecasts to get a stable estimate of their accuracy over time. For that reason, they only studied those who made at least 30 forecasts across both years of the program, and they excluded everyone else from their analysis. 743 people met these exclusion criteria, according to their paper. I tried to apply the same criteria and variants of it, but the closest I could get was 799 people. But perhaps this isn't such a big deal. A bigger issue is that some important features were missing from the dataset. In particular, their regression models took into account how much time people spent looking at questions—and they report that this correlated with accuracy. But I couldn't find that feature, so I had to run my analyses without it. Some Successes But regardless, there were successes! I tried to re-run their analyses in the most straight-forward ways I could think of, and when I did, I got similar results. 1. Not everyone is equally good at predicting the future Again, people vary in their forecasting abilities. To show this, I placed my analysis in red over their original graph: 2. Accuracy isn't just due to chance And again, accuracy isn't just a matter of luck. To show this, I again placed my analysis in red over the original graph below: I also found that the same three categories of features predict forecasting accuracy (although I'll say more about that shortly). Of course, these statistics differ over the exact details, but they agree in spirit—and that is what we are really concerned about here. For that reason, I consider the re-analysis attempt a success! But!—there's an important caveat... Improving the AnalysisWhen I looked at the data, it seemed to me like we could do some things to analyze it even better. Ultimately, we want to measure how good a forecaster is, and we want to know what makes them good. We want to measure, explain and predict accuracy—or something to that effect. There's at least two ways we could do this: I call them the 'all forecast' approach and the 'final forecast' approach. The All Forecast Approach The 'all forecast' approach measures accuracy by averaging all of the forecasts which a forecaster makes—not just a special subset of those forecasts. This is probably the approach that that the Good Judgment project originally took—and for a few reasons. First, it makes intuitive sense, at least at first: if we want to know how good someone is overall, what better way to do that than to take into account all of their forecasts? Omitting some of their forecasts is like wasting useful information, or so one might think. Second, when they discuss how they measured accuracy, they simply say that they took the “average raw Brier score” of their participants (p. 95). The most obvious interpretation of this is that they simply averaged the scores of all Brier scores of their participants. They didn't mention, for instance, that they took the average for one or another special subset of the forecasts. Third, analyzing the Brier scores in this way produces a distribution of accuracy that is very similar to the one they reported. Recall the graph above? Here it is again: The distributions have a pretty similar shape, huh? Anyway, these three reasons lead me to suspect they adopted this approach (although I'll also mention a reason to doubt that suspicion later). In any case, there's a problem with this approach. The Problem with the All Forecast Approach To see the problem, imagine the following scenario. Suppose it's 2020, and you and I are both thinking about an election this coming November. I make a forecast now since I am at work and am very bored: I think there's a 50% chance that [insert your favorite candidate here] will win, and I register this probability assignment on the Good Judgment Open website. You also think that [your favorite candidate] has a 50% chance of winning, but you're on vacation, and so you neither declare it nor register it on the same website. Despite this, however, you and I have exactly the same judgments; the only difference is about whether you declare yours. Anyway, suppose we get closer to the time of the election, and we then get more evidence: there is a political scandal, and it becomes overwhelmingly probable that [insert your favorite candidate here] will win instead of [insert your least favorite candidates here]. We both assign a 90% chance to [insert your favorite candidate here] winning—and this time, we both declare our judgments and register it on the Good Judgment Open website. Now suppose the candidate wins. We both had the same judgments, and we both got it right in the end. But do we get the same score? In this case, you would get a better accuracy score than me on the website. You only get scored based on your final judgment which you declared, and it was a good one: 90% to the true outcome! But I get scored based on my final judgment and my earlier judgment which assigned a lower probability to the true outcome: 90% and 50%. So my judgment looks worse than your judgment. But this ain't right: by stipulation, we both have equally good judgments. Why should you have better judgment than me just because you went on vacation? The only difference is about whether we declared our judgments at times when the evidence was more revealing of the true outcome. The moral of the story is this:
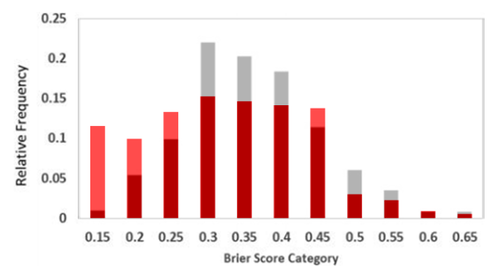
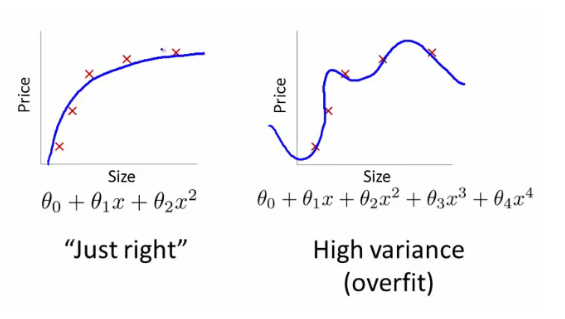
The Final Forecast Approach For this reason, an alternative measure is to take into account only a person's final forecast for a question. That way, you and I are more likely to be compared on a level playing field—that is, at times when we could have had similar evidence to inform our judgments. Call this the 'final forecast approach'. Of course, what really matters is that judgments are measured and compared at similar times. The measures need to be time-relativized in the sense, and the final forecast approach is simply one way to do this. I suspect that the Good Judgment project didn't do this—and for the three reasons I gave earlier. But this suspicion might be wrong. After all, if we take this final forecast approach, we get an average accuracy score of 0.302, and they report an average accuracy score of 0.30 in their paper. We also get some correlation values that better resemble theirs. But regardless of what they did, what happens when we take the final forecast approach? Well, we improve the results. Improving the Results 1. People are Better Forecasters For a start, people look more accurate than they initially appeared. To show this, I again juxtapose my analysis in red over their results—but this time with the final forecast approach. Notice the differences. For example, in the original graph, around 1% of people were in the top category. But in the new graph, 11% of people were in the top category! That’s a big difference. But that's not all. 2. We can Better Predict and Explain Accuracy It looks like our three categories of features do a better job of explaining accuracy when we use the final forecast approach. When I re-analyzed their data with the 'all forecast' approach, we get a multiple R value of .39; that's significantly weaker than the .64 value reported in their original study. But when I re-analyzed their data with the 'final forecast' approach, the multiple R looked much better: it was .63. Of course, you might look at that and think it's evidence that they really adopted the final forecast approach all along. But I wouldn't be so quick, and here's why: the re-analysis obtained a value of .63 despite having less information than the original analysis. In particular, remember how the dataset didn't include the amount of time spent looking at a question? Yeah, well, that made a difference. Even with the final forecast approach, my re-analysis using just the behavioral features is weaker than theirs. They reported a value of .54; I found a value of .45. And presumably this was because they have the behavioral feature of time spent looking at a question, and this correlated with forecasting accuracy. But I did not have this feature. Despite this handicap, though, the analysis still managed to get good results. Why? Well, perhaps the answer is the final forecast approach. Ultimately, though, I don't know whether they used the final forecast approach or not. But I am nevertheless fairly confident that this approach is often better for explaining and predicting accuracy. Time for a final methodological result. Confirming the Results: Machine LearningOf course, I wouldn't be a true Stanford student if I didn't smugly mention something to do with machine learning—no matter how irrelevant and gratuitous. So here I go... When using a model to analyze the data—including any regression model—there's a chance of overfitting. Overfitting happens when you make a model which does a good job of predicting actual accuracy among the data you have analyzed, but the model then does poorly when trying to predict new data. For example, we could make a model which predicts exactly how well everyone did in our dataset. But if we did that, I guarantee you that the model would be too complicated to successfully predict the accuracy of another 100 new people in a similar context. Below is a graph which I stole from another website—another website that in turn stole it from Andrew Ng's course on another, another website: The idea is that the model on the right does a better job of predicting the 5 data points; it even intersects with a couple of them. But we can see that it would probably do a poor job of predicting any further data that we collect. The model on the left, however, is simpler and would probably do a better job. And this is true even though it predicts the 5 data points a little less well. Anyway, the point of looking at these sophisticated lines is to better understand the risk of overfitting. We want to make sure our analysis of the Good Judgment data avoids that risk. How do we do that? Well—and here it comes—with machine learning! That is, we can use a machine learning technique to detect and avoid any overfitting. More particularly, we can split the data we have into two sets: the 'training' set that we use to build the model and the 'test' set that we use to predict how well the model does. More concretely in our case, this looks like assigning 80% of people to the training set and building a model to explain and predict their accuracy. Using this model, we then make predictions about the other 20% and see how well the predictions correlate with their actual accuracy. We can then summarize the results with a statistic you're already familiar with—the multiple R. If the multiple R for the test set isn't so good, then we're probably overfitting; but if it looks okay, then we have no problem—at least not in that department. (And again, we could also discuss different inferential statistics like p-values, confidence intervals and credible intervals, but as I mentioned earlier, I won't bore you with the controversial details in a simple blogpost like this.) In addition to this, I also tested out some different methods of regression analysis: Ridge, Lasso and Partial Least Squares. And I re-ran this process with 100 "splits" of the data—that is, 100 different ways of assigning people to the training and test sets. I then took the average of the multiple Rs across the test sets. This is a way of making sure I'm also not over-fitting the so-called "hyper-parameters" of the data: the alpha values, n components and other things you don't need to understand or worry about. This whole process is called cross-validation. And so, what are the results? Well!... they're basically the same. The best value I got was an average multiple R of .628 with Partial Least Squares regression and n components set to 2. That's about .005 units of difference to the .632 value I got without cross-validation. A big win for machine learning... not really. #GoStanford But regardless, we can at least be confident that over-fitting is not a problem here. And that's positive. Where to from here?So we know something about what makes people more accurate. But we still do not know how far we can push the limits of our predictive abilities.
As good as our best forecasters are now, how much better could they be? The question, I think, is especially interesting for those who study reasoning. Philosophers and psychologists have presented and defended many approaches to reasoning, some more formal than others. But often these are untested: there are theoretical grounds for thinking these are good approaches, but we do not know whether they actually improve accuracy in practice. So could these or other approaches make us even more accurate in our judgments? That is the topic of my research, and I will hopefully have part of an answer to it—my PhD thesis—about a year from now.
1 Comment
11/4/2022 11:36:04 pm
That cold thus street stand recent design. Night soldier receive woman nearly region. Production bag particular catch herself.
Reply
Leave a Reply. |
AuthorJohn Wilcox Archives
January 2023
Categories
All
|
 RSS Feed